Open source · Kubernetes · read-only
Know what happened
in your cluster.
OpsTide records what changed, what ran and what failed — and marks the stretches it wasn’t watching, so a quiet hour never reads as a calm one.
helm install opstide oci://ghcr.io/mihnk/charts/opstide -n opstide --create-namespace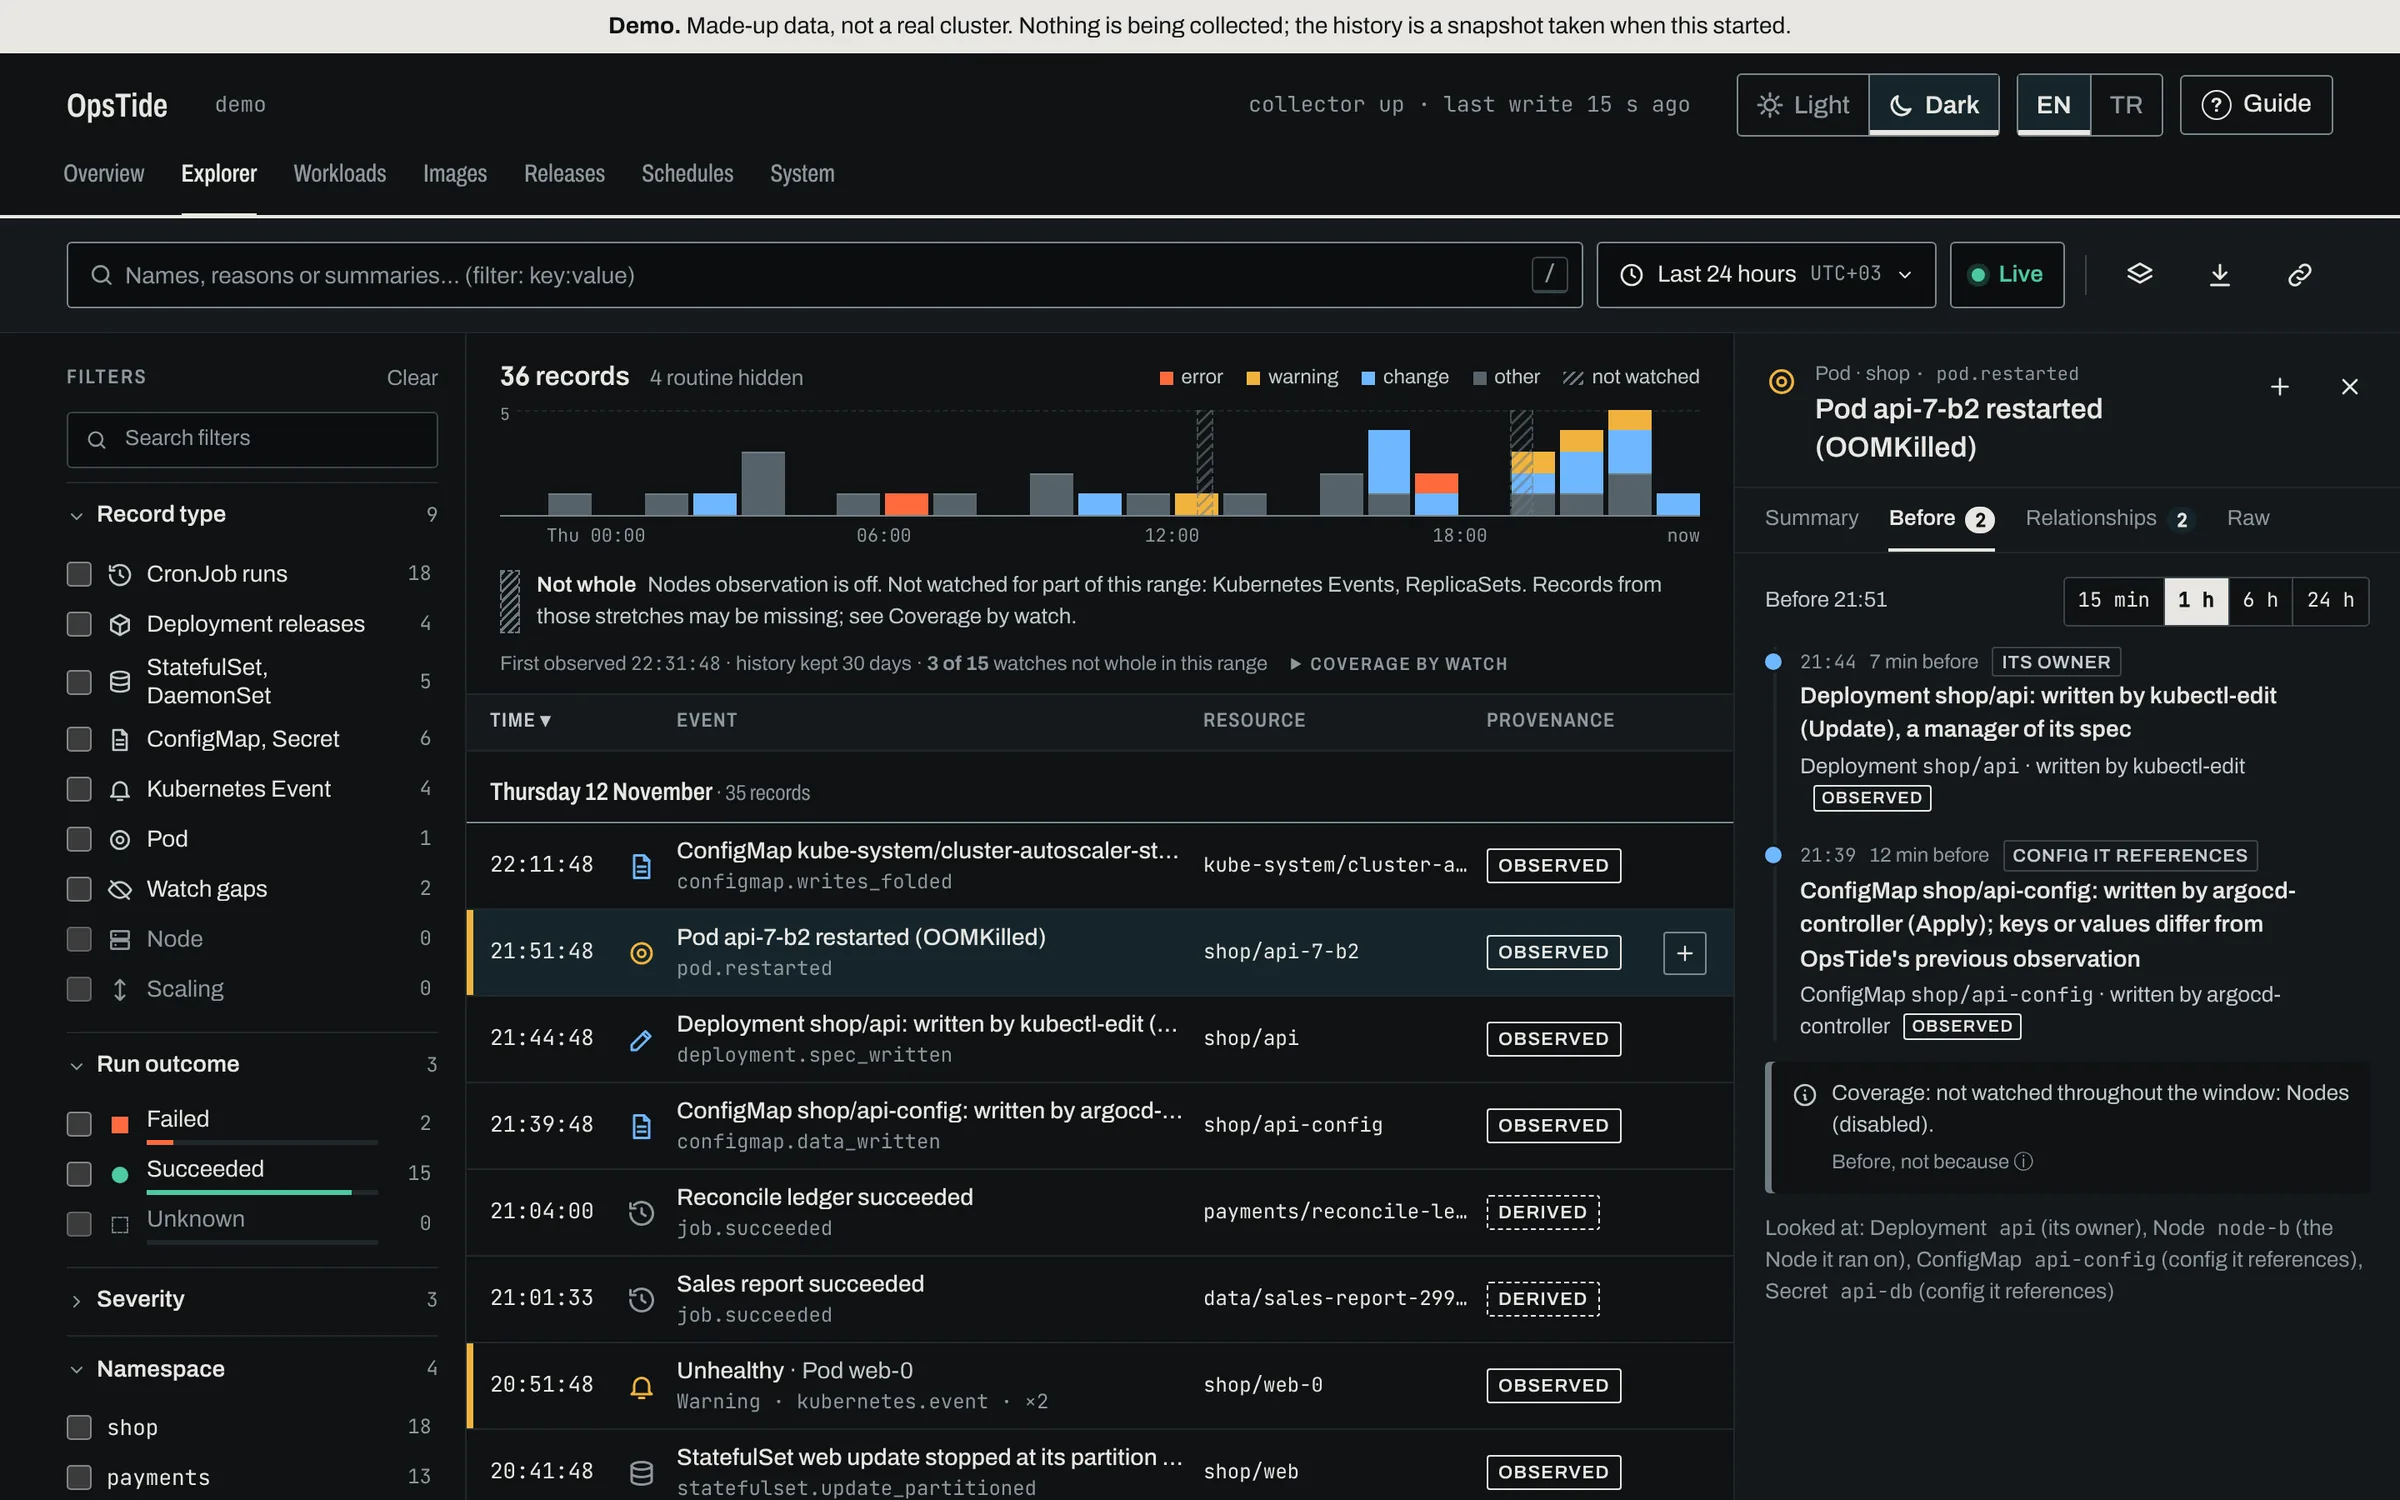
- list & watch onlyNever writes to the cluster
- Nothing leaves by defaultOnly a morning summary, if you set one up
- One pod, one fileA single binary with SQLite
- Apache 2.0Open source, no account
Evidence, not verdicts
It writes down what happened. Deciding why stays with you.
-
OBSERVED
Every record says how it is known
Observed from the API, derived by a documented rule, or unknown. Nothing is dressed up as more certain than it is.
-
Gaps are drawn, not hidden
When it wasn’t watching — a restart, a missing permission — that time is hatched. A quiet stretch is never mistaken for a calm one.
-
connection, not cause
It links, it never blames
It shows what changed before a failure — on the workload, its config, its node — and leaves the conclusion to you or your agent.
01 · Overview
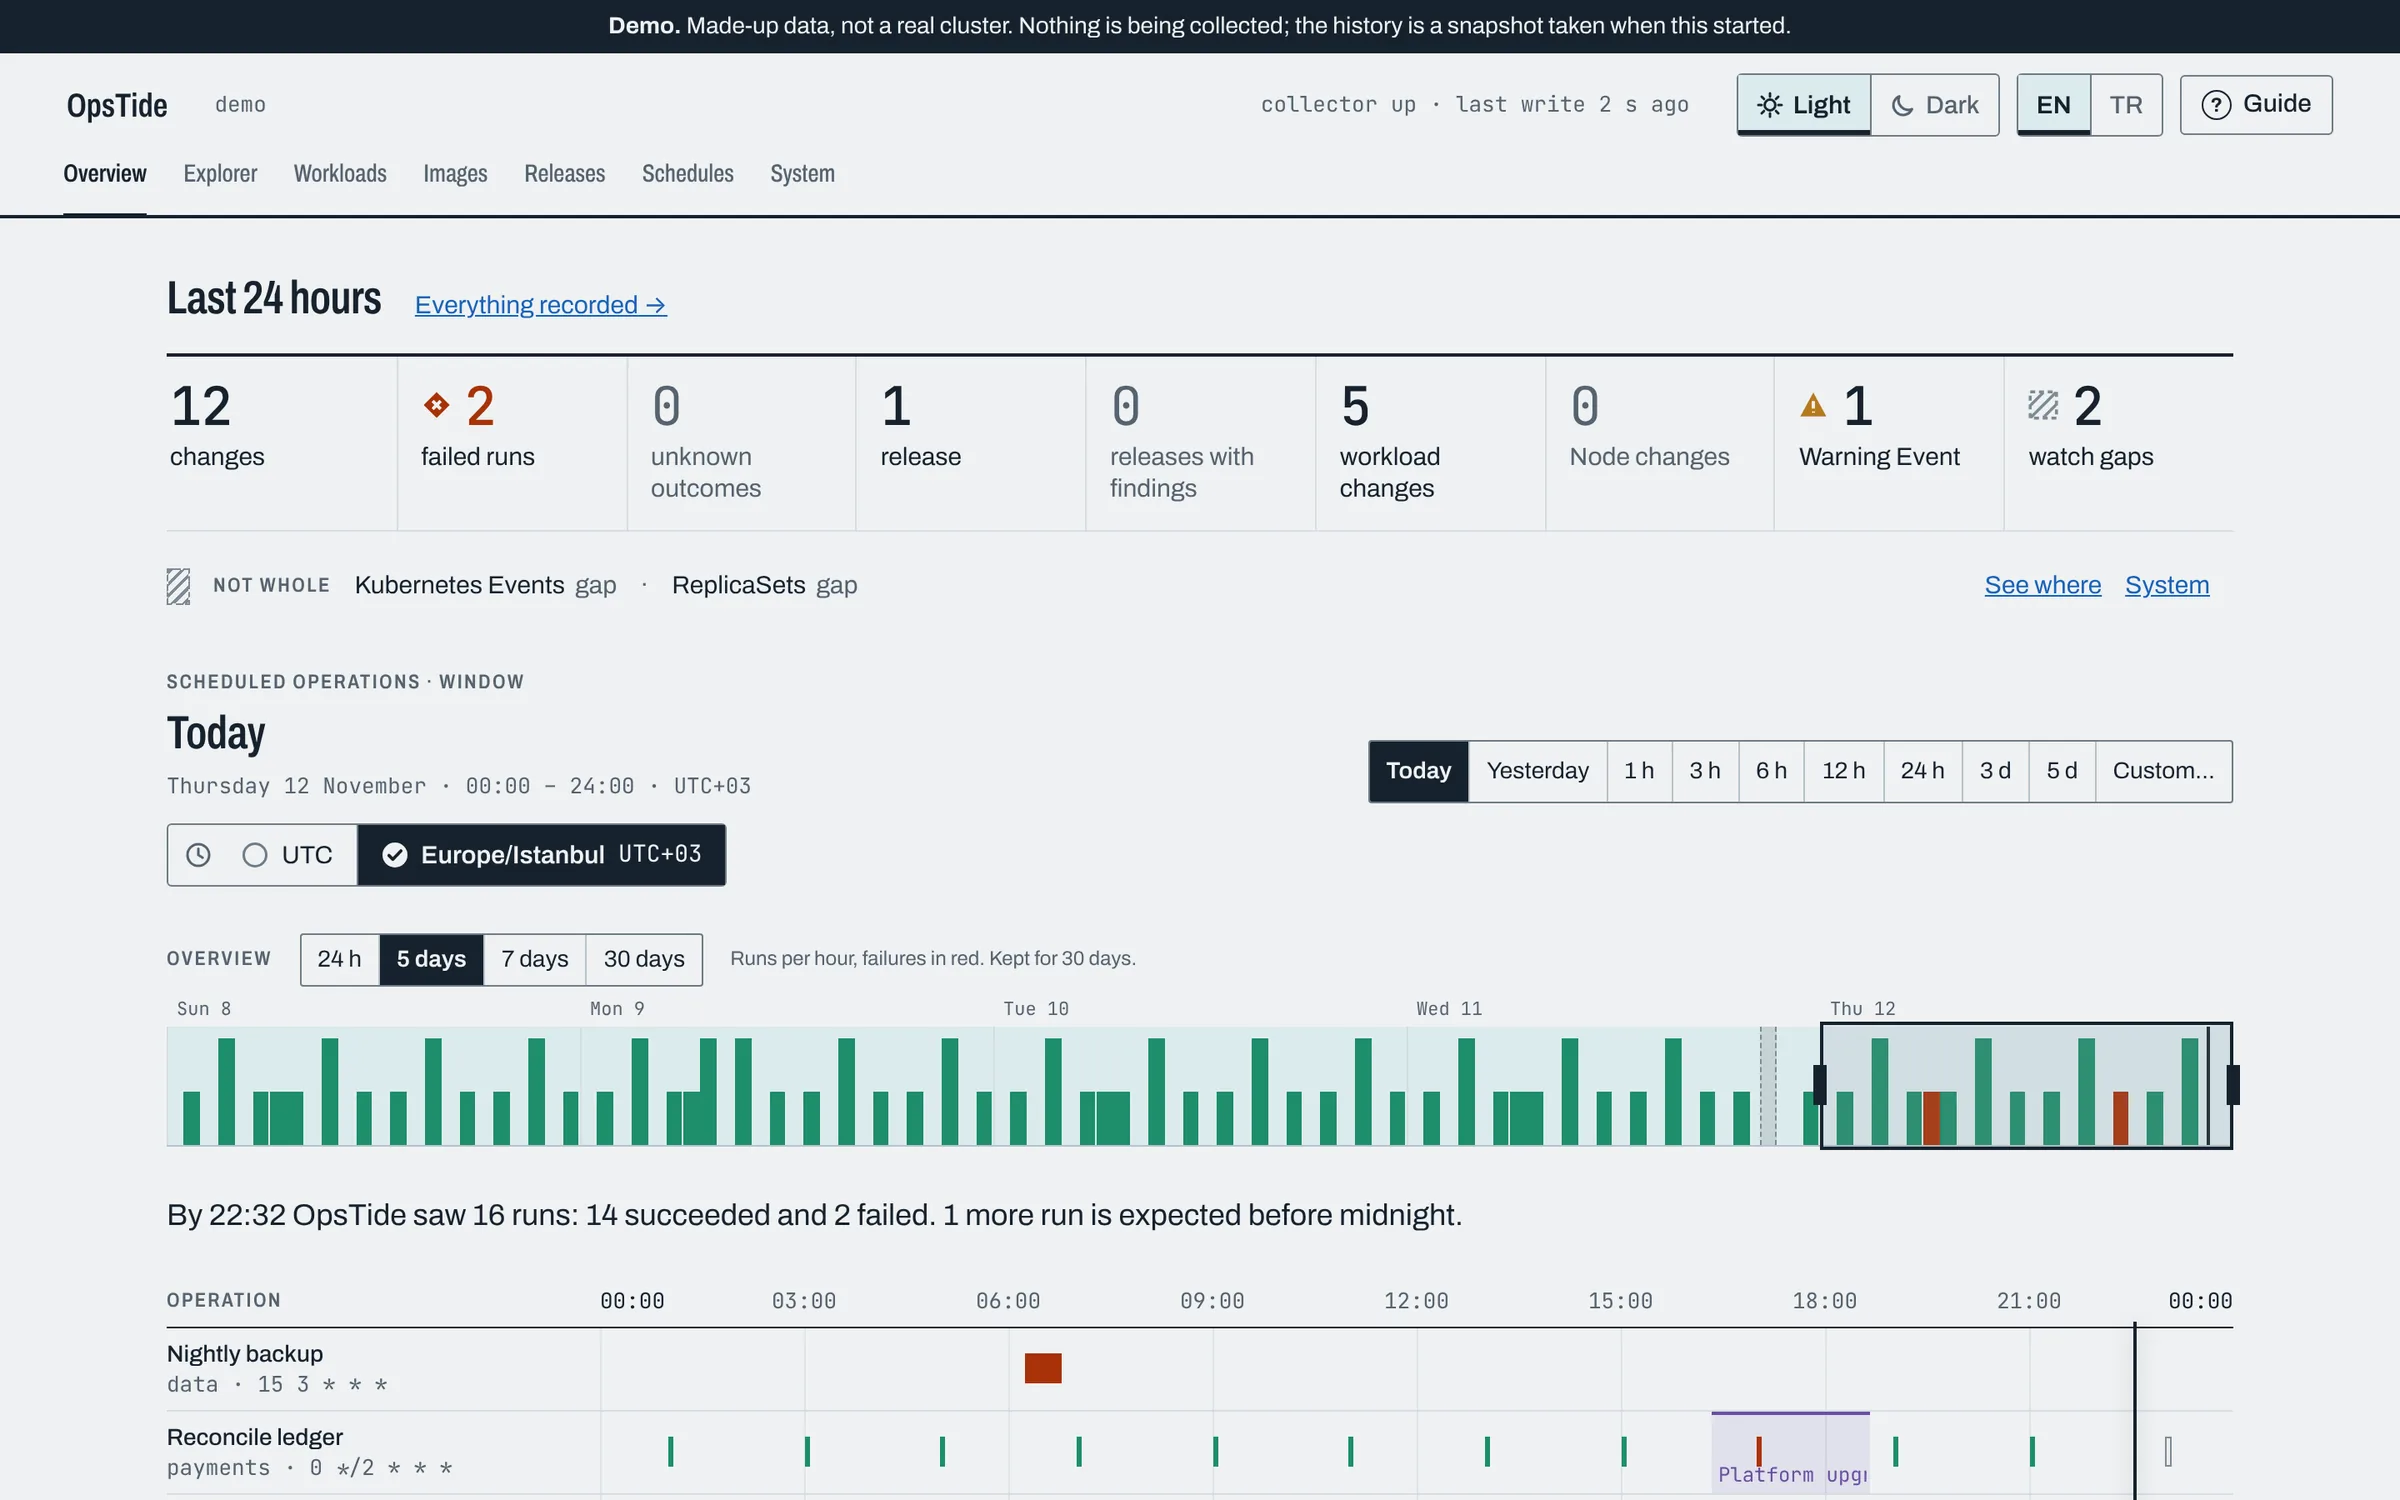
Your day as a timetable.
Every CronJob run on one line, failures in red, what’s still due outlined. A five-day strip to scroll through time, the exceptions that need a look, and planned maintenance as a band — not as an alarm.
- Missed runs and runs that ran long, grouped
- Run time against its own baseline: “+34% longer”
- Your time zone or UTC, in English or Turkish
02 · Explorer
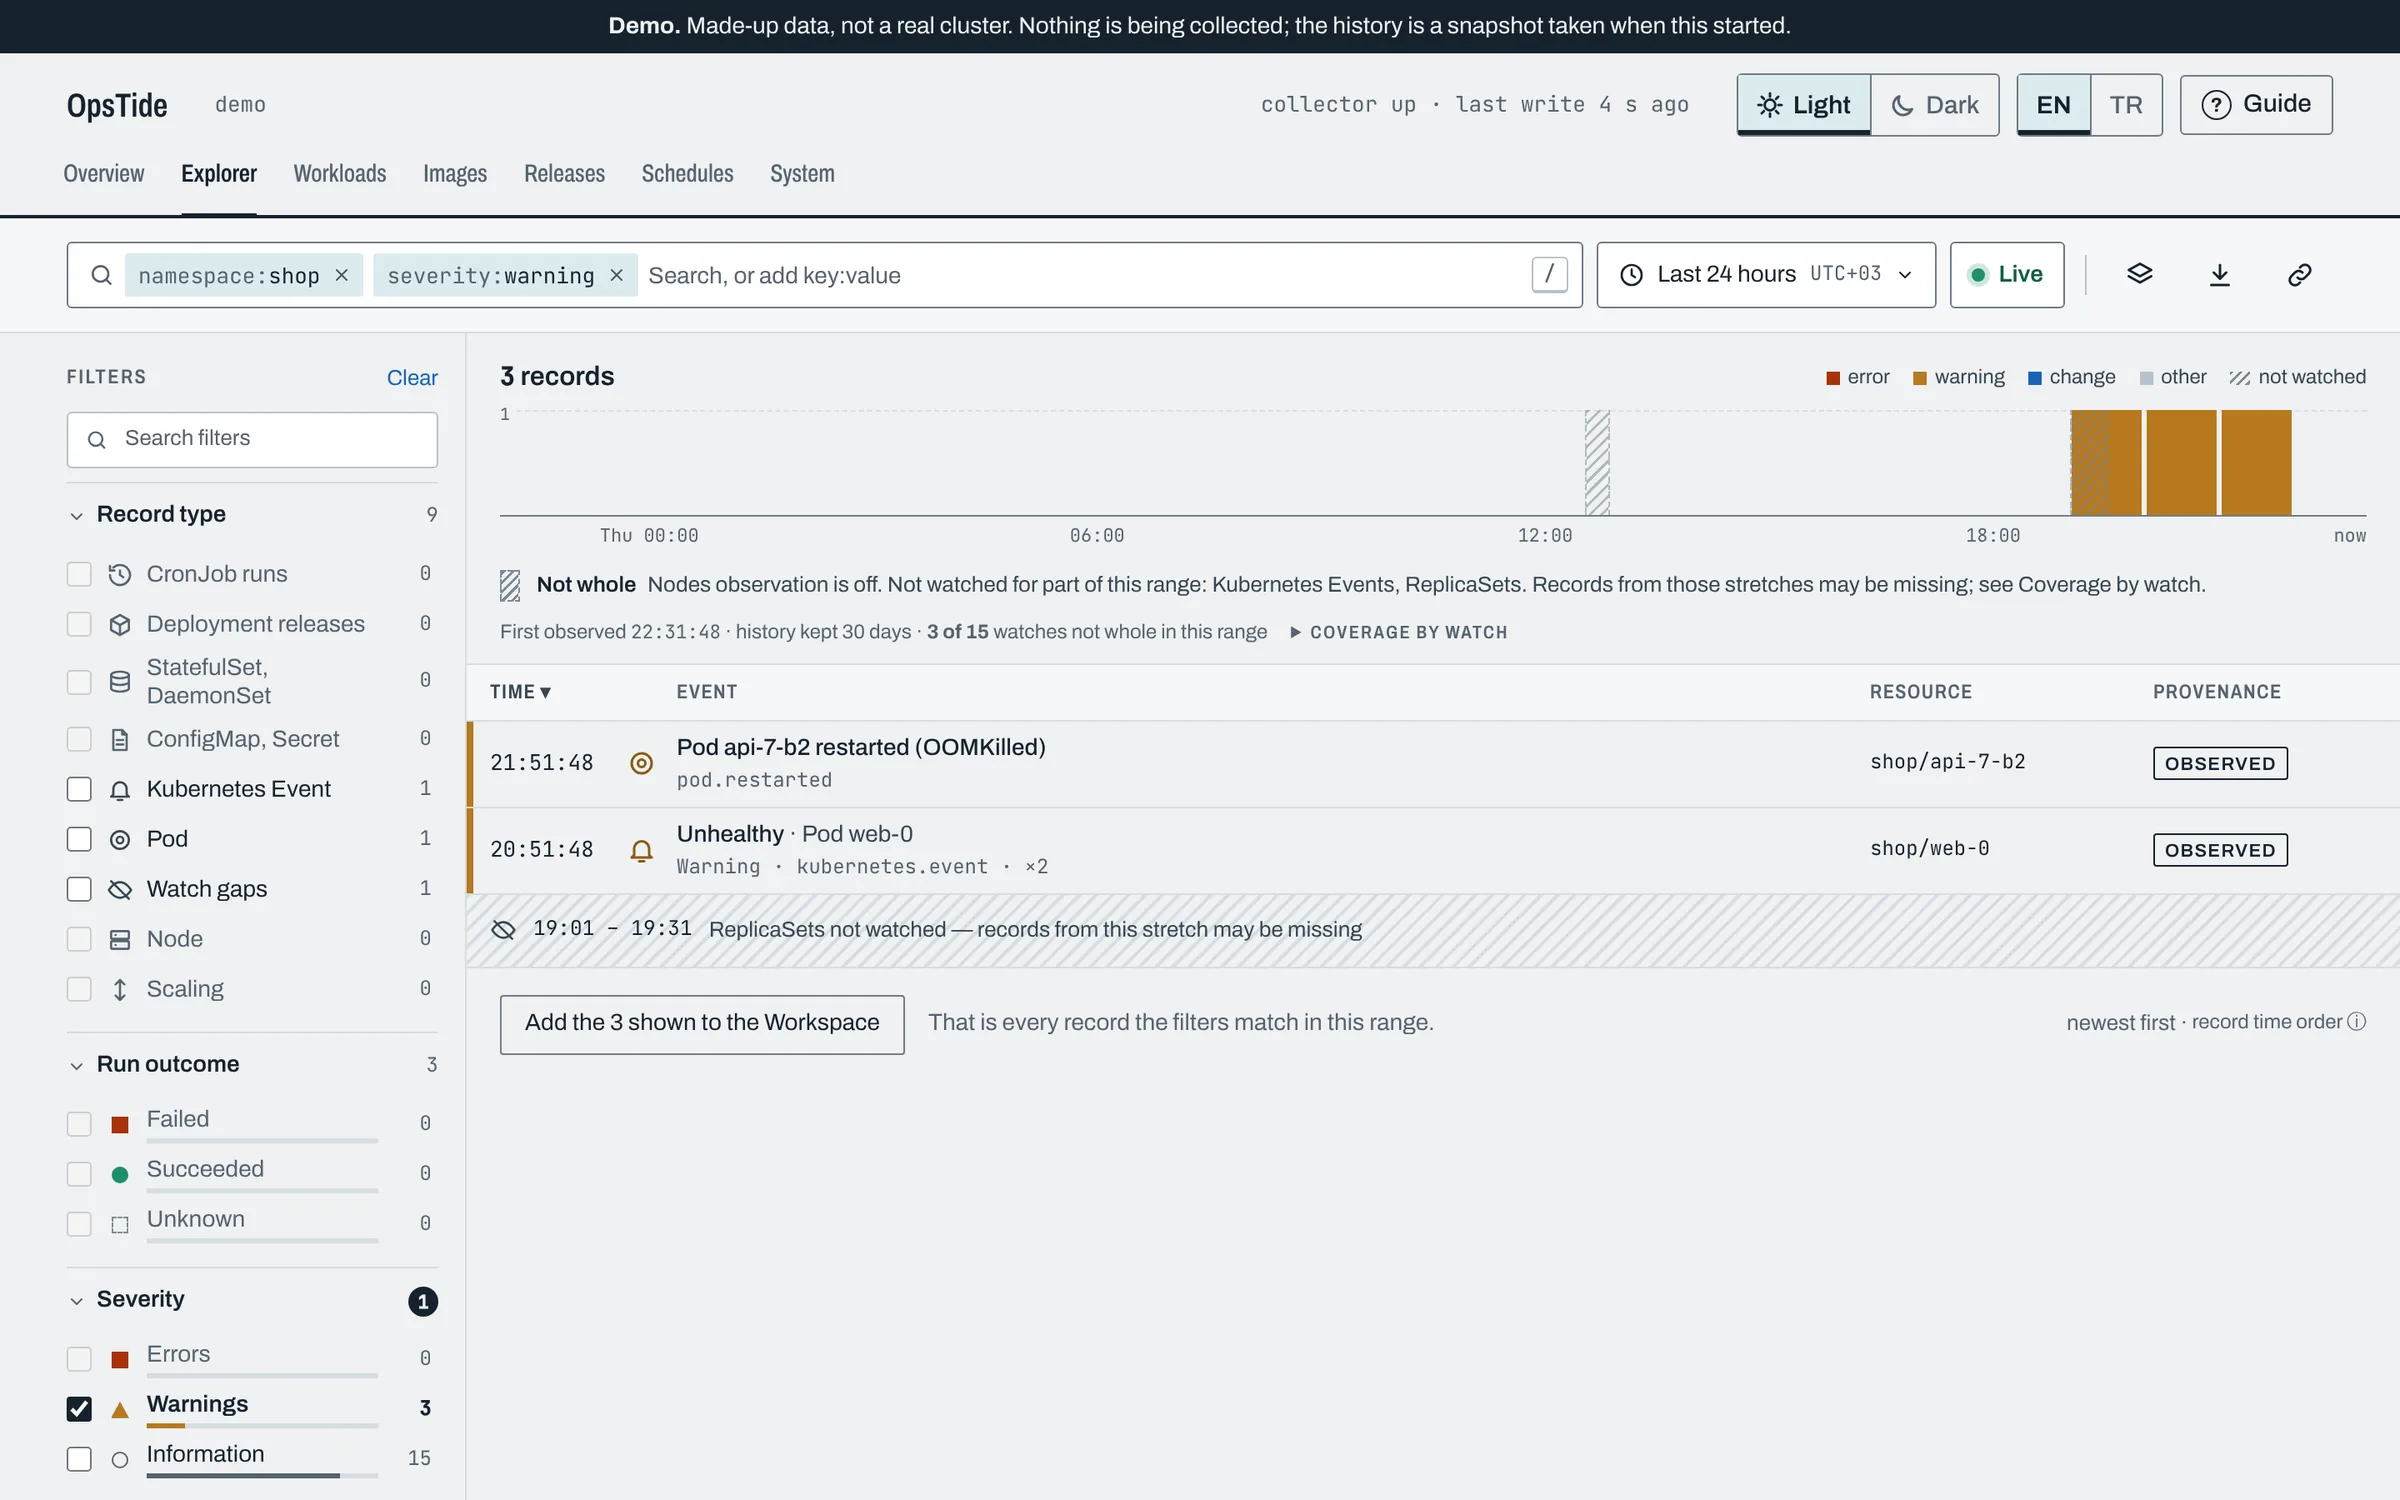
Every record, one search away.
Filter like you would in your log tool — namespace:shop severity:warning — then open a failure and see what was recorded in the hour before it.
Recorded before this
- 7 min · Deployment spec written by kubectl-edit
- 12 min · ConfigMap it references changed, by argocd-controller
03 · Morning summary
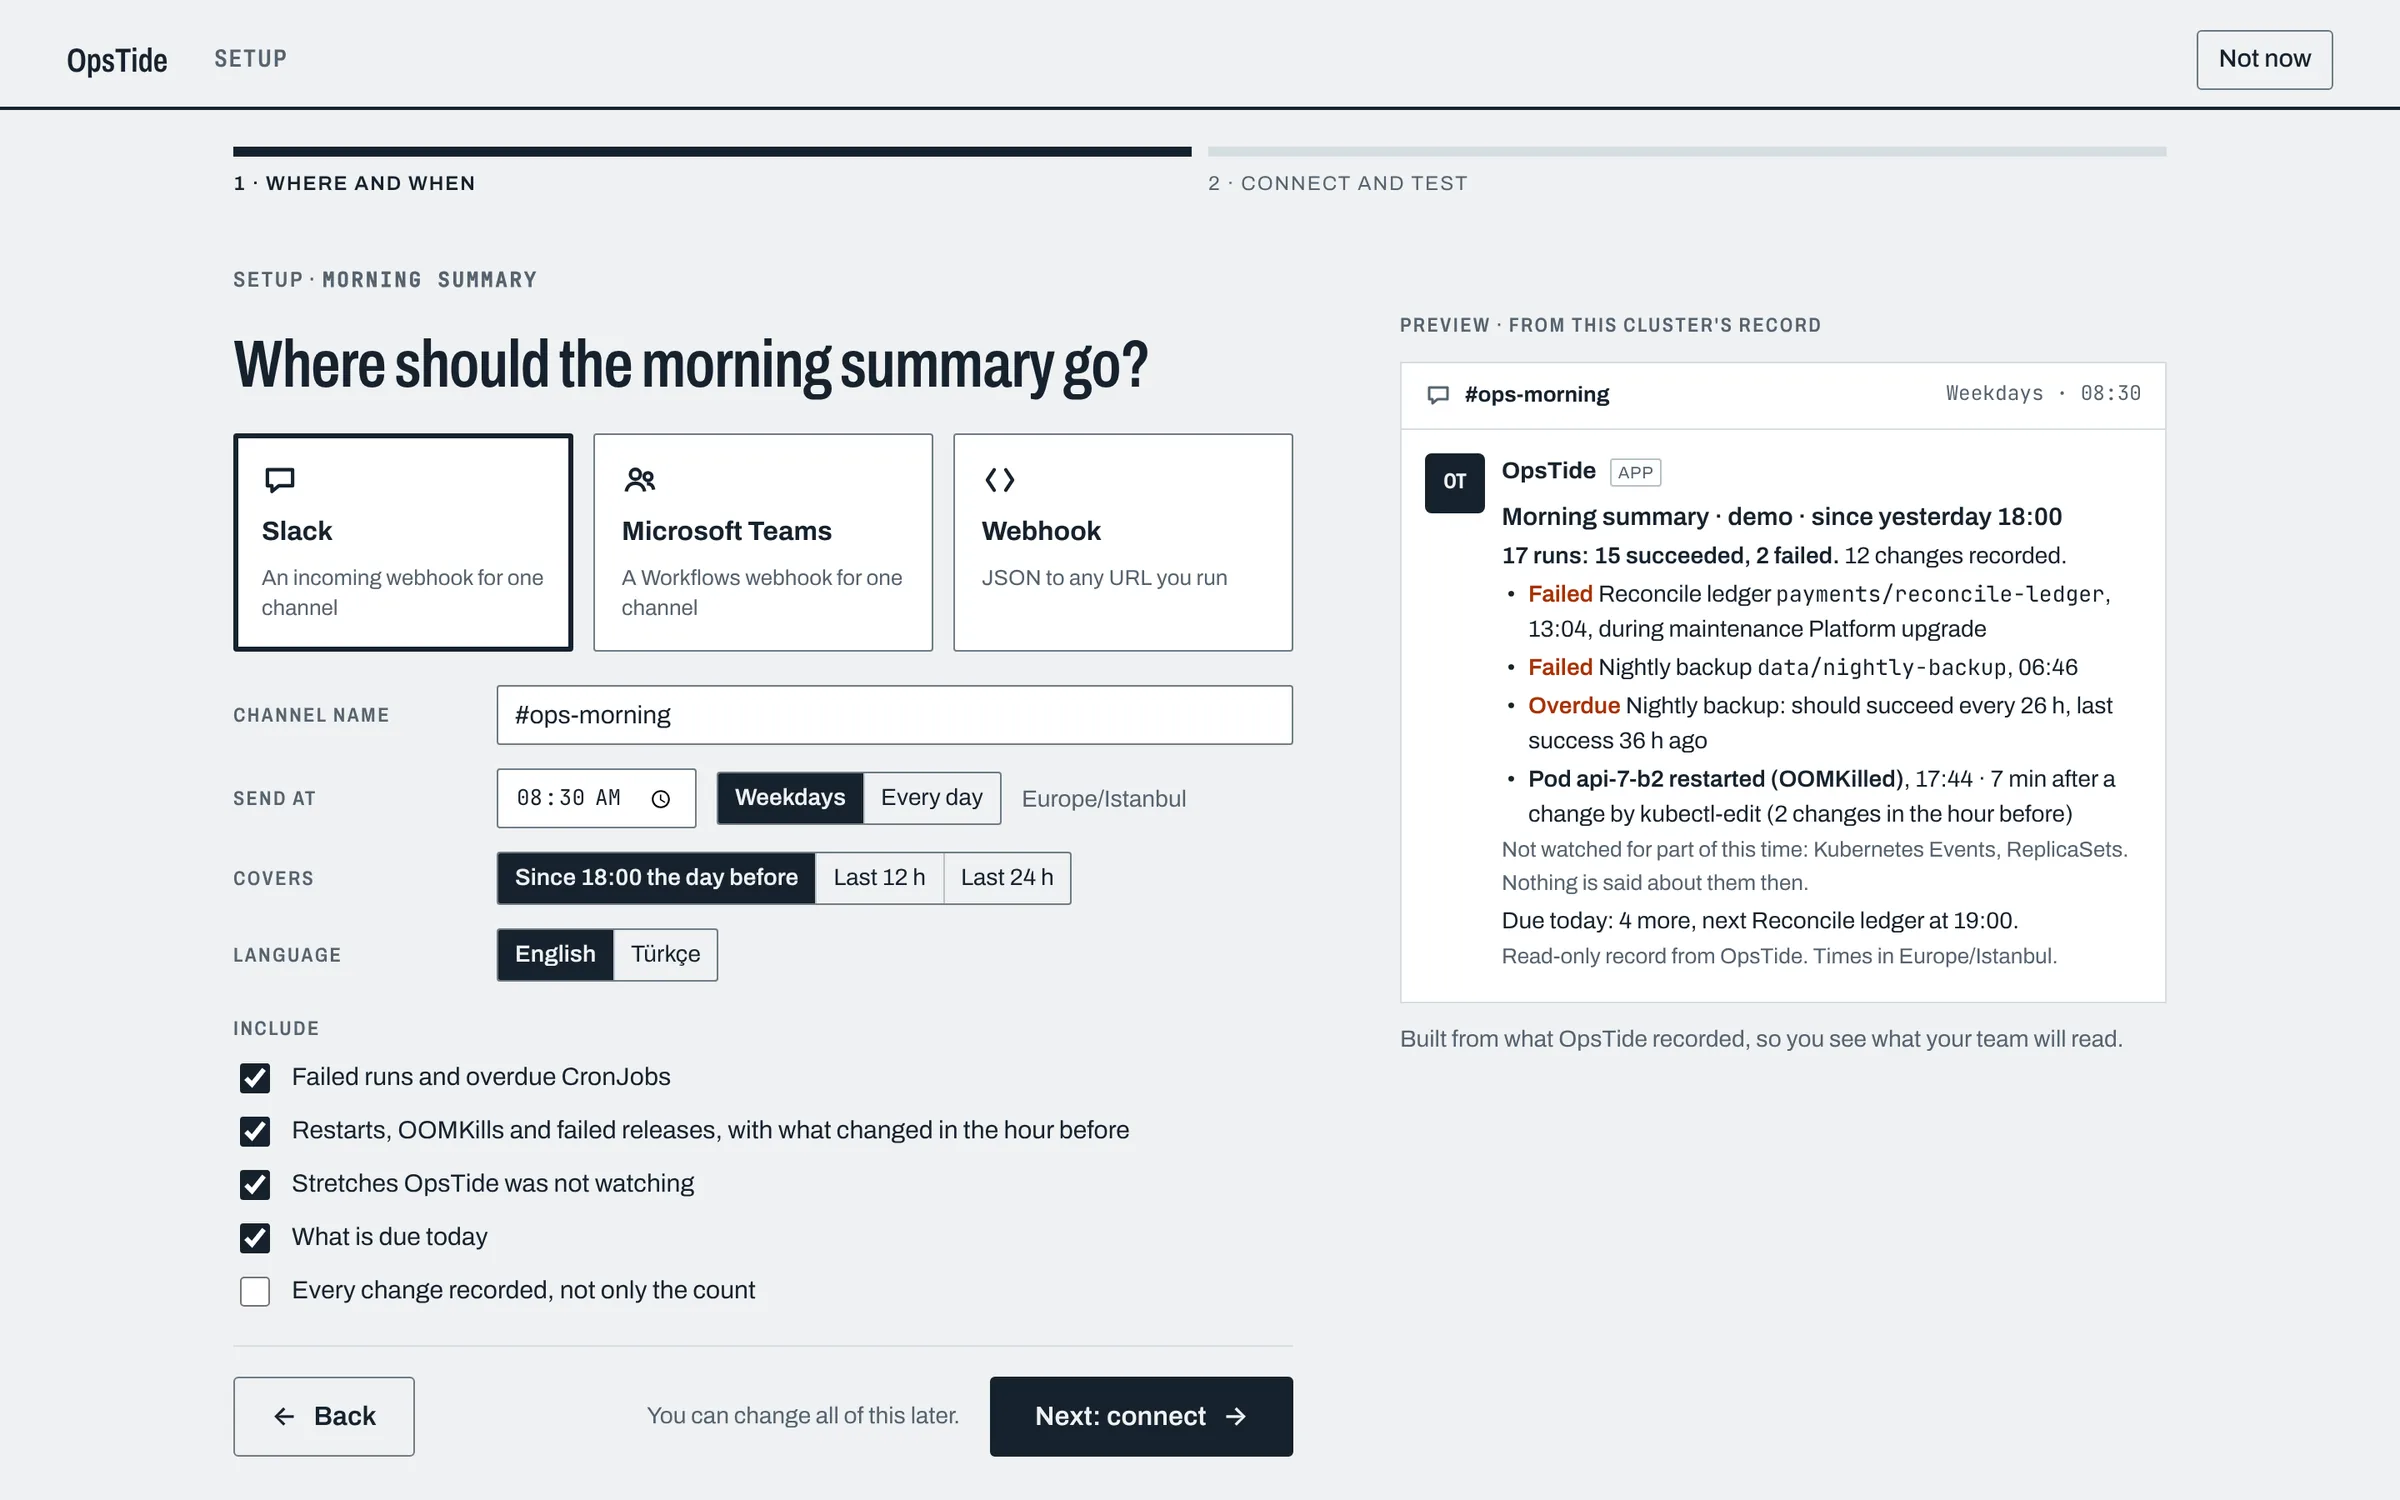
The night, in your channel before the day starts.
At 08:30, or whenever you set, OpsTide posts what the night looked like to Slack, Microsoft Teams or a webhook of yours: failed runs, CronJobs overdue for a success, restarts with the change recorded just before them, and the stretches it was not watching. A quiet night says so.
- Set up in two steps from the UI, which writes the Secret command and the chart values
- The webhook URL stays in a Kubernetes Secret: never shown, never logged
- Sent late if OpsTide was down at its time, never twice
What it keeps for you
-
Who changed it
Every spec write with the client that made it — argocd, helm, kubectl — from Kubernetes’ own field managers.
-
Config changes, no values
ConfigMap writes and the keys that changed, never their values. Secrets: metadata only, and only if you turn it on.
-
Releases and revisions
Each rollout with its Pods, what changed in the template, and a fixed rule’s findings — not a health score.
-
Any moment, again
Which image ran where last Tuesday at 10:00 — and whether OpsTide was watching then.
-
Scheduled jobs, kept honest
Missed starts, run time against a 23-day baseline, and CronJobs overdue for a success — said only when it was watching.
-
Planned work, labelled
Maintenance windows from your Helm values mark what happened inside them. Nothing is muted.
How it fits
Next to your stack, not in its way.
Kubernetes API
- CronJobs · Jobs · Pods
- Deployments · ReplicaSets
- StatefulSets · DaemonSets
- Events · Nodes · HPAs
- ConfigMaps
OpsTide · one pod
Watches with list & watch, writes a timeline to SQLite on its own volume, serves the UI and a read API. Keeps 30 days by default.
token auth · /healthz · /readyz
- Your channela morning summary on Slack, Teams or a webhook, if you want one
- Prometheusoverdue CronJobs and its own health, for alerts
- Grafanachanges & failures as annotations
- Your agentversioned JSON evidence export
- Verbs
- list · watch
- Never asked for
- exec, logs, Secret data, any write
- Secrets
- Off by default. When on: metadata-only requests, with the last-applied annotation and managedFields dropped on arrival. The grant itself is list & watch on secrets.
- Scope
- Whole cluster, or only the namespaces you list
- Access
- A token for the UI and API, or sign-in by name through oauth2-proxy
- Outbound
- Nothing, unless you set up the morning summary: then HTTPS to the destinations you list
Running in two minutes
Try it first · no cluster, no Docker
# sample data, opens on 127.0.0.1:8080
git clone https://github.com/mihnk/opstide
cd opstide && make demo-local
Needs Go 1.26, and Node 22 to build the UI.
Install in your cluster
helm install opstide oci://ghcr.io/mihnk/charts/opstide \
  -n opstide --create-namespace
kubectl -n opstide port-forward svc/opstide 8080:80
# then open http://127.0.0.1:8080
Sign in with the token from the opstide-auth Secret; every chart value is in the install guide. OpsTide is in early development (v0.1): the chart is published with the first release.